English
Deutsch
Short Introduction
to Systematic Tolerance Calculation with TOL1
The TOL1 Manual contains a detailed introduction to tolerance calculation.
If you wish to carry out your own small tolerance calculation with the demo
version you should work through the following small example first. The
example will help you to get to know how TOL1 carries out a tolerance
calculation. The demo version demonstrates the tolerance calculation
automatically.

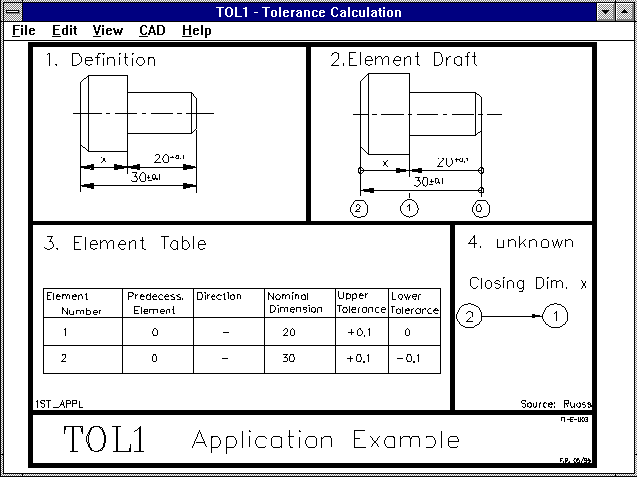
1. Description of Example
The dimension x of the supporting bolt is to be calculated.
2. Element Diagram
All necessary dimension levels for the tolerance calculation are numbered
commencing with zero. For practical reasons the level at the center of
the diagram, from which all dimensiones commence, is assigned the element
number zero in complex tolerance calculations.
3. Element Table
All dimensiones are listed in a table of element numbers. In order to visualise
this better, the dimension chain has arrows from the last element to the current
element. The direction is '+' or '-' depending on whether the arrow shows
in a mathematically positive or negative direction. Dimension 20 is the
distance between element 0 and element 1. Dimension 30 can be defined from 0 to
2 in a negative direction. The dimension of element 2 after element 1 is
required.
4. Definition of Intervals to be Calculated
The dimension x represents the distance between element 1 and element 2.
5. Input of Dimension Elements
This is where the PC comes into use. The element table from the
diagram shown above is entered appropriately, then the dimension of element 1 to
2 is defined as the critical distance.
6. Input of Critical Distances
The distance to be calculated is entered.
7. Output of Critical Distances
The dimension x with greatest and smallest dimension, with constant distribution and
with Gauses Normal Distribution will be displayed on screen or printed out.
Application Example for Tolerance Calculation
Stop Bolt
Calculation of Head height x
| El. | Vorg. | ± | Nomin.Dim. | Upper Deviation | Lower Deviation | ISO Tolerance | Remark |
| 1 | 0 | - | 20.000 | 0.100 | 0.000 | ..... | support |
| 2 | 0 | - | 30.000 | 0.100 | -0.100 | ..... | head |
Clamping Dimension with Constant Distribution
| Dis | tance | Nomin.Dim. | upper tol. | lower tol. | Max.Dim. | Min.Dim. | Remark |
| 2 | 1 | 10.000 | 0.100 | -0.200 | 10.100 | 9.800 | Head height x |
Clamping Dimension with Gausses Normal Distribution
| Dis | tance | Average Dim. | upper tol. | lower tol. | Max.Dim. | Min.Dim. | Remark |
| 2 | 1 | 9.950 | 0.112 | -0.112 | 10.062 | 9.838 | Head height x |
Clamping Dimension:  9.950 mm  +/-  0.112 mm  for  +/-  3.00 Sigma

1. Range of Probability

   z      Expected       Probability      Expected       Probability

[Sigma]    value                           value

 -5.0    X <   9.764mm     0.00003 %      X >   9.764mm   99.99997 %

 -4.0    X <   9.801mm     0.00317 %      X >   9.801mm   99.99683 %

 -3.0    X <   9.838mm     0.14000 %      X >   9.838mm   99.86000 %

 -2.0    X <   9.875mm     2.28000 %      X >   9.875mm   97.72000 %

 -1.0    X <   9.913mm    15.90000 %      X >   9.913mm   84.10000 %

  0.0    X <   9.950mm    50.00000 %      X >   9.950mm   50.00000 %

  1.0    X <   9.987mm    84.10000 %      X >   9.987mm   15.90000 %

  2.0    X <  10.025mm    97.72000 %      X >  10.025mm    2.28000 %

  3.0    X <  10.062mm    99.86000 %      X >  10.062mm    0.14000 %

  4.0    X <  10.099mm    99.99683 %      X >  10.099mm    0.00317 %

  5.0    X <  10.136mm    99.99997 %      X >  10.136mm    0.00003 %


2. Probability Interval

  z         Dimension interval for the        Probability     Spoilage

[Sigma]        expected value                              quota

  0.5       9.931mm < X <   9.969 mm      38.30000 %    61.70000 %

  1.0       9.913mm < X <   9.987 mm      68.26000 %    31.74000 %

  1.5       9.894mm < X <  10.006 mm      86.64000 %    13.36000 %

  2.0       9.875mm < X <  10.025 mm      95.44000 %     4.56000 %

  2.5       9.857mm < X <  10.043 mm      98.76000 %     1.24000 %

  3.0       9.838mm < X <  10.062 mm      99.73000 %     0.27000 %

  3.5       9.820mm < X <  10.080 mm      99.95000 %     0.05000 %

  4.0       9.801mm < X <  10.099 mm      99.99370 %     0.00630 %

  4.5       9.782mm < X <  10.118 mm      99.99932 %     0.00068 %

  5.0       9.764mm < X <  10.136 mm      99.99994 %     0.00006 %
8. Saving Data
The entered elements, critical distances and results can be saved in a file.
Price List |
Order |
Return

