FED1,2,3,4,5,6,7: Haigh-Goodman Diagram
The Goodman diagram used for helical spring calculation is derived from the commonly used Smith diagram. The Smith diagram is used for dynamical stressed components (alternating or pulsating). The load of helical springs is maximum pulsating (tau 1 = 0), never alternating (tau 1 < 0). Goodman develops for this applications the well-known chart. Smith diagram defines the diagonal line as mean stress (tauM = tauMax - tauMin), Goodman diagram describes the diagonal line as minimum stress tauMin.
Besides the Smith diagram, another similar model, the Haigh diagram is used. The Haigh diagram can nearly be described as a Smith diagram that is rotated 45 degrees clockwise. Instead of the diagonal line, here the x-axis defines the mean stress. Advantage of the Haigh diagram: it is easier to get the admissible amplitude for a given mean stress directly from the y-axis. HEXAGON material database WST1 provides both, Smith and Haigh diagram.
Smith diagram in WST1 (torsion, d=10mm)

Haigh diagram in WST1 (torsion, d=10mm)

In the same way, the helical spring programs provide now a so-called "Haigh-Goodman-Diagram". This is a Haigh diagram for pulsating load, with minimum stress tauMin on the x-axis and admissible stress variation tauH on the y-axis.
Goodman diagram in FED1+

Haigh-Goodman diagram in FED1+

SR1 - Force Table
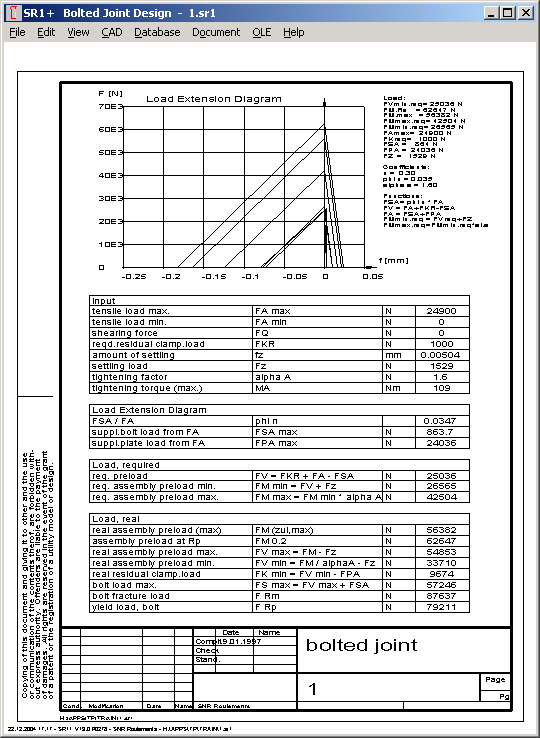
For better understanding of the theoretical and real forces in the bolted joint used by VDI 2230, SR1+ provides a new drawing with tables separated to input loads, forces of load-extension diagram, required forces and real loads.

FED10 - Input Dimensions as Table

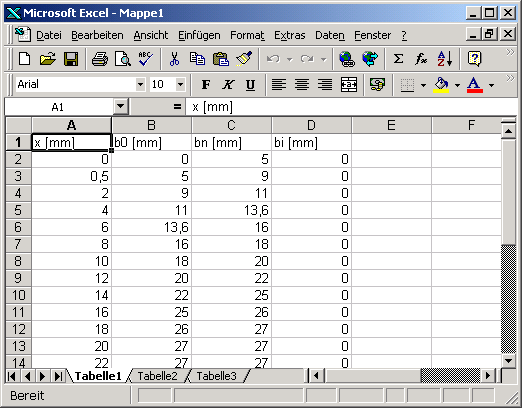
Sections of a leaf spring may now be entered in a table inside FED10, or with Microsoft Excel. That makes sense for complex geometry, or if the shape of the leaf spring is defined by mathematical formulas.

WN6 - ISO Tolerance
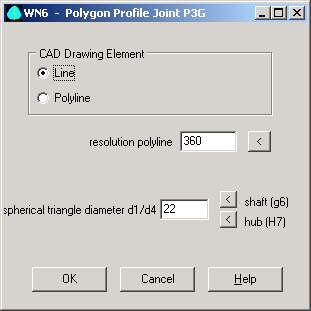
ISO tolerances for the spherical triangle diameter of the P3G profile are now calculated by WN6.

For generating the P3G profile as DXF or IGES drawing, you can modify the spherical triangle diameter or set the average tolerance for shaft and hub profile. Profile data can be used for generating the P3G profile by means of CNC or erode machinery.
