
WST1: Alloy Components

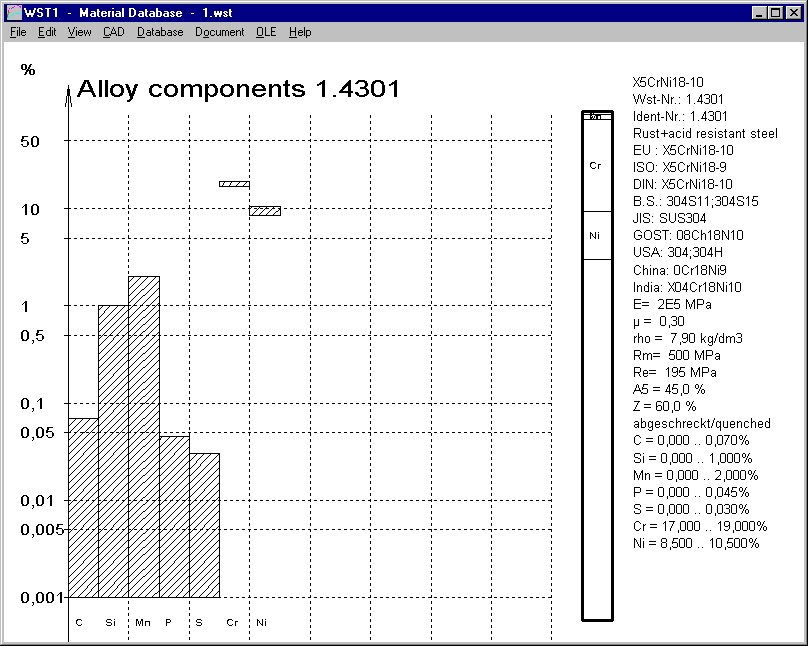
A new graphic was created to visualize alloying elements in a bar chart. Min and max values of the alloy components are drawn in a logarithmic scale so that even small shares are visible.
And database has been updated, so that alloy components of almost every steel material in the database are included now.
WST1: Chinese and Indian material names added in the comparison table
Database with international material names was extended by material names according to Chinese and Indian Standard, and by ISO material names as well.
WST1: Quick4 View

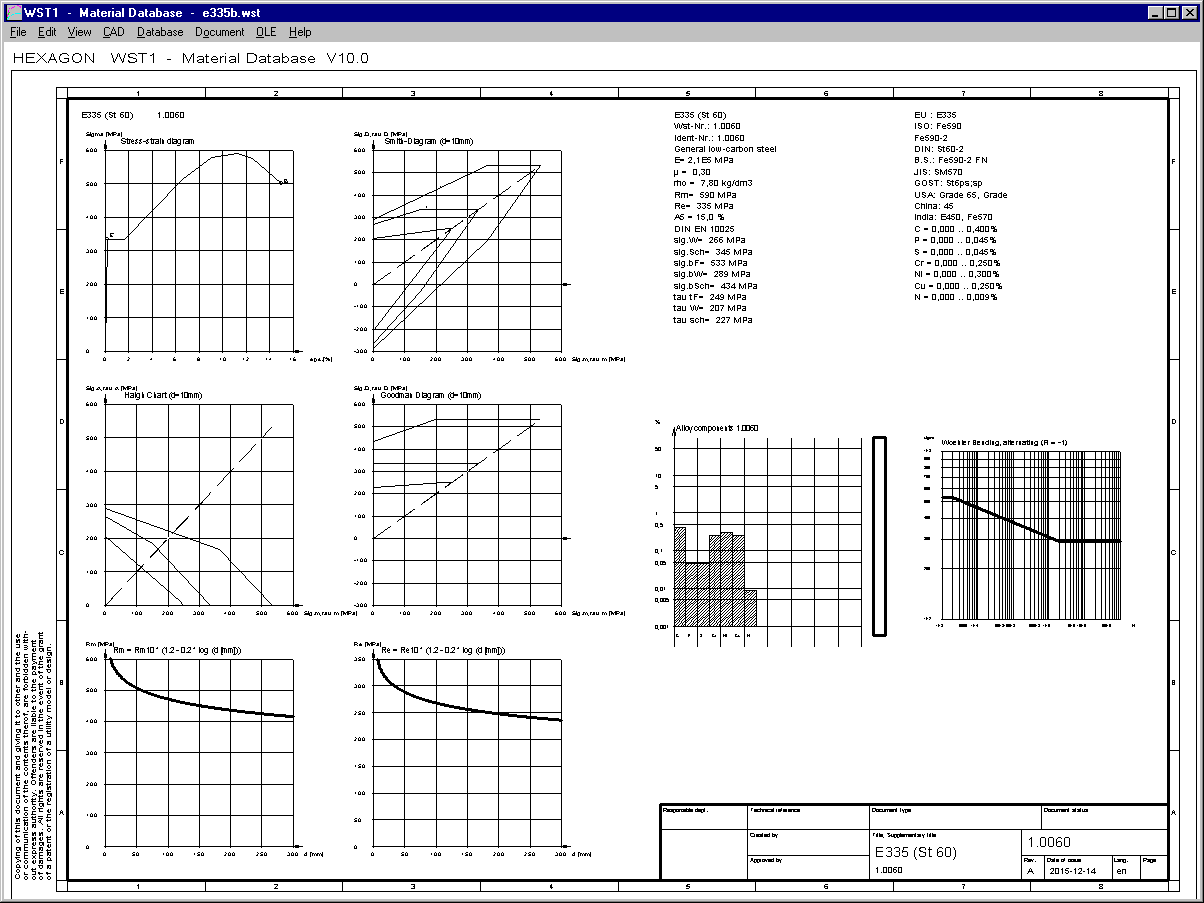
New Quick4 View includes material properties and diagrams in an ISO 7200 drawing frame on one screen.
WST1: Woehler Curve
Auxiliary image and help text has been added to the Woehler diagram input window.


You can create 6 different Woehler curves in WST1: tension/pressure, bending and torsion, each of it for alternating load or pulsating load.
FED1+, 2+, 5,6,7: JIS Fatigue Strength Diagram
Japanese standard JIS B2704-1:2009 uses fatigue strength diagram similar as the well-known Goodman diagram. X axis defines lower shear stress coefficient tau1/Rm, and y axis defines upper shear stress coefficient tau2/Rm, as factor of tensile strength. Diagram is limited by 2/3*Rm. The point x=y=2/3*Rm is the origin of the life cycle lines for 1E7, 1E6, 1E5 load cycles.

Permissible variation of shear stress at pulsating load (tau1=0) is used to construct the JIS diagram from Goodman diagram material data. Our compression spring software provide now five types of fatigue strength diagram: Goodman, Haigh-Goodman, Smith, SN (Woehler) and JIS.
FED1+, 2+, 3+, 5, 6, 7: Get approximate Goodman Diagram from pulsating shear strength
Create a Goodman diagram without measured Goodman diagrams by use of the JIS fatigue strength diagram methods with 2/3 Rm limit. Pulsating shear strength and static shear strength (permissible shear stress) together with tensile strength is sufficient to create a fatigue strength diagram. In the JIS example, permissible shear stress 0.45 Rm (not 0.56 Rm) was used. According to JIS, horizontal limit line depends on permissible setting of the spring and may be higher or lower as 0.45 Rm.
This simple construction does not completely match with a measured fatigue strength diagram, but approximation may be sufficient for a new material with unknown fatigue strength properties.
A new auxiliary image F1-E-106 was created with formulas to set fatigue strength parameters in FEDWST.DBF from static shear strength and pulsating shear strength of compression springs.

FED1+, 2+, 3+, 5, 6, 7, 8, 11: SWP-A and SWP-B spring wire added to database
Spring wires SWP-A and SWP-B according to JIS have been added to "fedwst.dbf" material database. SWP-A is similar with DM and SWP-B comparable with DH according to EN 10270-1.

FED1+, 2+, 3+, 5, 6, 7, 8, 11: Wire diameter tolerance according to JIS G 3522

Spring software can calculate wire diameter tolerance according to Japanese JIS G 3522 now.
FED1+: Load Spectrum
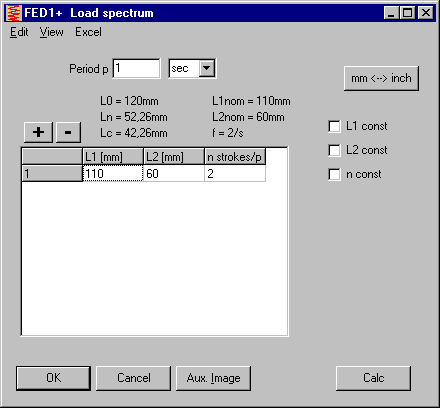
In FED1+, you can define varying stroke or spring lengths together with load cycles in a period of time. Period can now be entered in seconds as well as minutes, hours, days and years. Some simple application examples for better understanding of compression spring load spectrum with FED1+:
Example 1: Spring with constant stroke and constant load cycle frequency in continuous duty
This corresponds to FED1+ input without load spectrum. Calculation with and without load spectrum must lead to equal results.
Load cycle frequency is 2 Hz. Load spectrum includes only one share with L1, L2, and number of load cycles. If period 1 sec defined, input 2 load cycles for 2Hz.


Example 2: Spring with constant stroke and constant frequency with 20% duty ratio.
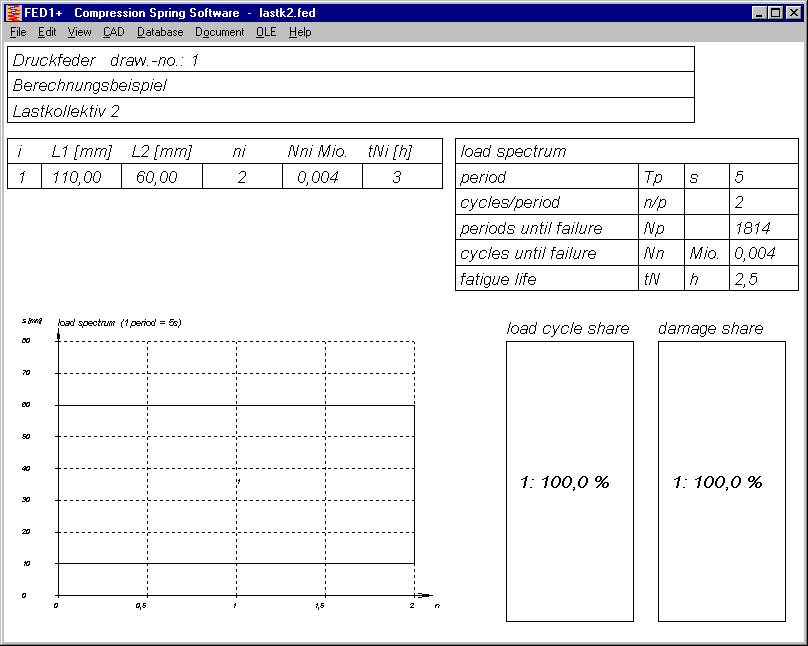
Same as previous example, but spring is not operated in continuous duty. Switch-on-duration is 20%. Simply modify period from 1 sec into 5 sec. Spring operates 1 second and makes 2 load cycles at 2 Hz. Then 4 seconds stop period. Calculated lifetime in hours is now 5 times higher than in continuous duty.


Example 3: Spring with constant, varying load cycle frequency at 20% duty ratio
Spring makes 120 strokes/min (2 Hz) for 6 minutes, then 80 strokes/min (1.33 Hz) for 6 min. Then 48 minutes stop period. Makes 6*120 = 720 strokes and another 6*80 = 480 strokes, together 1200 load cycles in one hour. Calculated lifetime in hours is 6 times higher in load spectrum as in continuous duty with 2 Hz.


Example 4: Spring with constant frequency, but varying stroke at 20% duty ratio.
Spring works between L1=110mm and L2=70mm for 4 minutes, then between L1=110 and L2=60mm for 4 minutes, then between L1=100 and L2=60mm for 4 minutes. Then 48 minutes stop period. Load cycle frequency 2 Hz, makes 480 load cycles in 4 minutes
Calculated lifetime in hours is 13 times higher (in load cycles 2.5 times higher) in load spectrum than in continuous duty with 2 Hz and 50 mm stroke.
Compare load cycle share and damage share of the load spectrum elements in the bar graph.


FED1+, 2+, 3+, 5, 6, 7: Production Drawing ISO 7200 with 10 mm sheet border

If ISO 7200 title block with 10 mm sheet border was configured, some tables in A4 production drawings are now compressed so that drawing content no longer interfere with 10 mm border
FED1+, FED5, FED6: Input bore diameter for production drawing
At "Edit->Production drawing", you now can enter mandrel diameter as well as bore diameter with tolerance for bedding of the compression spring.

FED1+,2+, 3+, 5, 6, 7: No-show load cycle frequency in production drawing
If "Display F1,F2.." was unchecked at "Edit->Production drawing", production drawing shall be free of application data. Therefore, load cycle frequency is no longer printed in the production drawing for this case.
FED5: Animation with load-deflection curve
Load deflection curve has been added to the animation screen of the conical compression spring.

FED1+, 2+, 3+, 5, 6, 7, 8, 11: Self-defined material data saved
Self-defined material data are saved together with the spring dimensions. Nevertheless, better select material from database, else the software cannot calculate important spring properties:
FED9: Spiral spring drawing with bent spring ends

Bent spring ends are drawn now, if length and bending radius of spring ends was defined.
FED1+: Buckling spring marked by "<" sign in the drawing
A "<" symbol in the spring drawing signifies that the spring buckles. At "Animation" you can watch when the spring begins to buckle.

FED1+: Various bedding coefficients in buckling diagram
If the spring buckles at spring length L2, buckling diagram now is extended by positions for bedding coefficients nue=0.5, 0.707, 1 and 2 (*L0/Dm). By this you can see if and how bedding of the spring can be modified to prevent buckling of the spring.

SR1+: New VDI 2230-1:2015
New release of VDI 2230 was issued in November 2015. It is approximately identical with the release of December 2014. Changes are not described. I found some mistakes corrected:
Modifications and corrections in VDI2230-1:2015
pg. 36 (R9): Calculation according to equation (186)
pg. 102: equation (211): "RS3" changed in "RS" .
pg. 102: equation (213) .. + 1.2 * P changed in 2 * P.
pg. 122: table A9: 42CrMo4: pG = 300 N/mm² changed in 1300 N/mm².
pg. 122: table A9: GJL-250 mat.no. 0.6020 changed in 0.6025.
pg. 132: example B1: R2: FKerf = 103 N changed in in 10³ N.
pg. 134: example B1: R8: FSmax = 64 194 N changed in 66 194 N.
pg. 155: example B4: R8: .. "with equation (178)" changed in .. "with equation (163)".
pg. 170: example B5: R11: mvorheff changed in meffvorh.
Obviously, only the most conspicuous mistakes have been corrected. And not even these corrections done consequently. In equation (213), the "mzu" for reduced thread length by chamfers was changed from 1.2 P into 2.0 P. But in example B3, the old formula with 1.2 P was used.
SR1+: Calculation according to VDI 2230-1:2015
Only few modifications were required to adopt SR1 and SR1+ to the new VDI 230 standard of 2015: In material database "mat_p_2.dbf" and "pressung.dbf", material number of GJL-250 changed from 0.6020 into 0.6025.
The modified "2.0 P" in equation (213) has no influence in SR1+, because you can input the reduced thread length "mzu". The suggested value (by "<" button) was and remains 2*P for TBJ and 3*P for TTJ (because non-bearing thread length of bolt is longer than of nut).
In SR1+, only the reference to VDI 2230 had to be changed from 2014 into 2015. Additionally, V21.0 of SR1+ provides new database tables with min/max values of friction classes according to VDI 2230 (µG and µK) and interface friction between clamping plates µTr. Tables can be displayed as help for input of friction coefficients..
SR1+: Database warnings at temperature calculations
Warning "mat_bolt.alphaT<>mat_b_at20!" means that thermal expansion coefficient in "mat_bolt.dbf" differs from the value in "mat_b_a20.dbf "with thermal expansion coefficient at 20°C. Reason for the difference may be that in the base data sometimes the value for heating up from 20°C to 100 °C was used.
In "mat_b_at.dbf", value AT100 of heat treatable steels was changed from 1.11E-5 into 1.15E-5. At 20°C, thermal expansion coefficient is 1.11E-5.
Warning "mat_bolt.alphaT<>mat_b_at20!" now will be shown only if deviation is more than 5%.
SR1+: Diagram alphaT = f(T) added to bolt material diagrams

Bolt material properties at "View->Material->Bolt (mat_bolt)" have been extended by a new diagram with thermal expansion coefficient as function of temperature. Cause table values of VDI 2230 (table A10) mean the heat-up from 20°C to the table value, it are shown as rectangle to 20°C in the diagram. SR1+ calculates the thermal coefficient between the given points on the x axis:
Thermal expansion for heat-up from 20°C to 100°C is AT100*L*(100°C-20°C) and for 20°C to 200°C is AT200*L*(200°C-20°C). Thermal expansion for heat-up from 100°C to 200°C is then the difference between these results. Mean thermal expansion coefficient for heat-up from 100°C to 200°C is then:
AlphaT100..200 = AT200*(200-20) – AT100*(100-20) / ((200-20)-(100-20))
These thermal expansion coefficients are calculated, marked between the known temperatures (i.e. 150°C) and drawn as curve.
If you scroll the different bolt materials at "View->Material->Bolt (mat_bolt)" maybe you find conspicuous thermal expansion coefficients for 1.4980 with zigzag curve. And also for 2.4952, the thermal expansion is lower at 150°C than at 20°C. Either this must be a very specific property of chrome nickel alloys, or the table A10 in VDI 2230-1 is incorrect for these materials.

LG1, WL1+, ZAR5: Roller bearing calculation: aISO to DIN ISO 281 with EP additive
Lubricant with EP additive can be considered in roller bearing life calculation according to DIN ISO 281 now.

LG1, WL1+, ZAR5: Roller bearing calculation: a1 according to DIN ISO 281
Reliability 99.2%, 99.4%, 99.6%, 99.8%, 99.9%, 99.92%, 99.94% and 99.95% has been added for a1 coefficient. The a1 values of 90% till 99% were slightly modified according to latest ISO standard.
TR1, FED10: New input window for bedding of girders and leaf springs
Input window for bedding in TR1 and FED10 is now designed as in WL1+ shaft calculation program. This eases input for special bedding on 2, 3, 4 or 5 bearings.

ZAR3+: Animation Worm Gear Drive
Animation shows motion of worm and worm wheel on screen.

All programs: "File -> New" and "Edit -> New"
For a new calculation you can run "File -> New" for a sequence of input windows. At some of the programs you could run "Edit -> Quick" to start again the input window sequence, but without reset of input data. This menu option was renamed now into "Edit -> New", or added to all programs where missing.
All programs: Quick View with shortcut Alt-V-1,2,3,4
Shortcuts for Quick view were unified for all programs to show Quick View by means of key combination Alt-V(iew) and then 1,2,3,4 for Quick1,2,3,4 View.
Room License for Universities as Network Floating License (20-User)
Room licenses for education are no longer unlimited to any computer in one room, but limited to simultaneous access to maximal 20 workstations in a room.